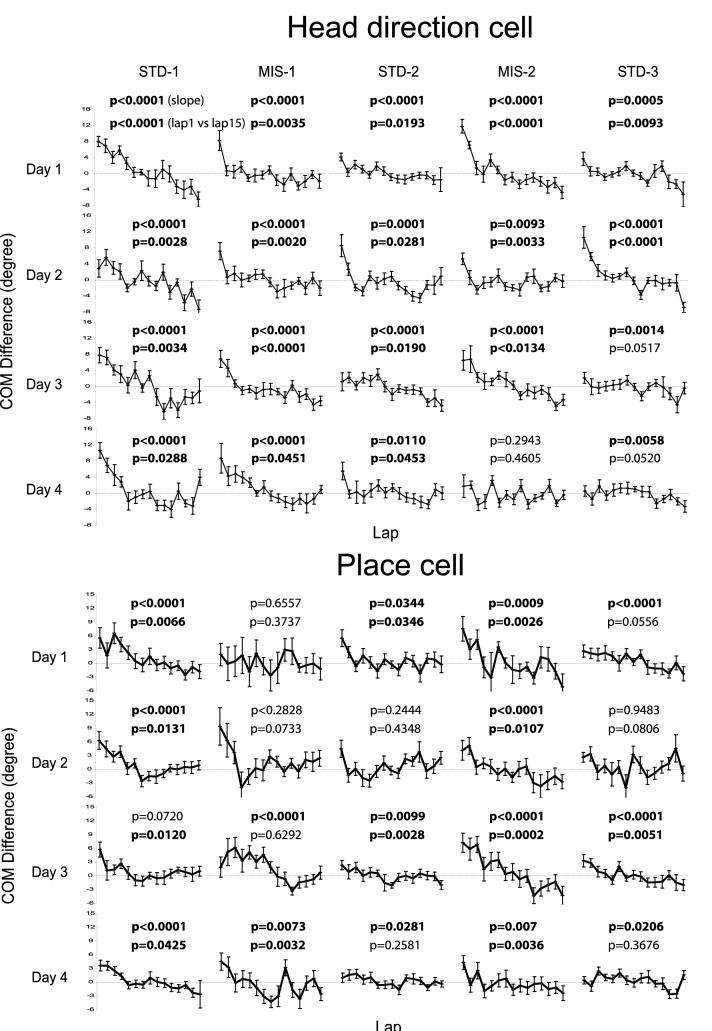
Figure 3.
Backward COM Shifts in Simultaneously Recorded Head Direction Cells and Place Cells during 4 Days of Recording
Data from all rats (n = 6) are averaged and segregated into the 5 sessions the rats experienced each day (STD-1, MIS-1, STD-2, MIS-2, and STD-3). The COM differences are normalized by the session means. The numbers above each curve are the p-values for the linear regression (upper number) and the t-test between the COMs of lap 1 and lap 15 (lower number). Numbers in boldface denote significantly negative slopes or significant difference between the COMs of lap 1 and lap 15 (p < 0.05). Error bars in the graphs are standard errors.

