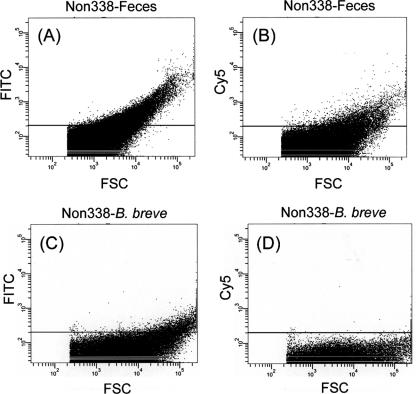
FIG. 2.
FCM dot plots of fecal samples hybridized with Non338-FITC (A) and Non338-Cy5 (B) and plots of B. breve cells hybridized with Non338-FITC (C) and Non338-Cy5 (D), monitored using FCM. Fluorescence intensity is indicated on the vertical axis, and FSC intensity is indicated on the horizontal axis. The area above an intensity of 200 in FITC and Cy5 (solid line above horizontal axis in each panel) was evaluated as the occurrence of autofluorescence.

