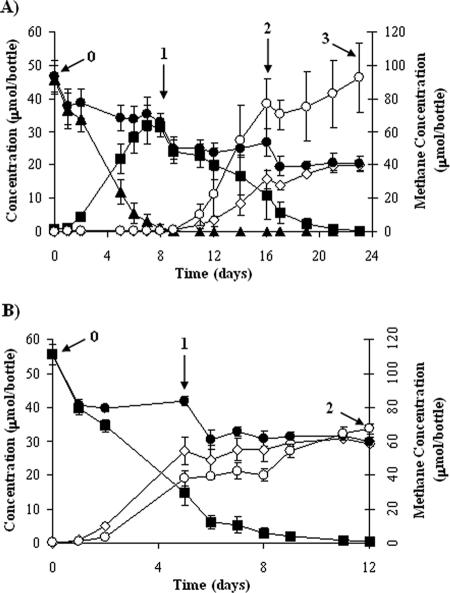
FIG. 1.
Degradation profiles for 1,1,1-TCA and 1,1-DCA time course experiments. (A) Degradation in 1,1,1-TCA-amended cultures. (B) Degradation in 1,1-DCA-amended cultures. Closed triangles, 1,1,1-TCA; squares, 1,1-DCA; open diamonds, CA; closed circles, total chlorinated ethanes; open circles, methane. Numbers indicate the approximate time points for DNA extraction in the respective experiments (see the text). Each curve shows the mean value for three bottles. Error bars show the standard deviations for three bottles.

