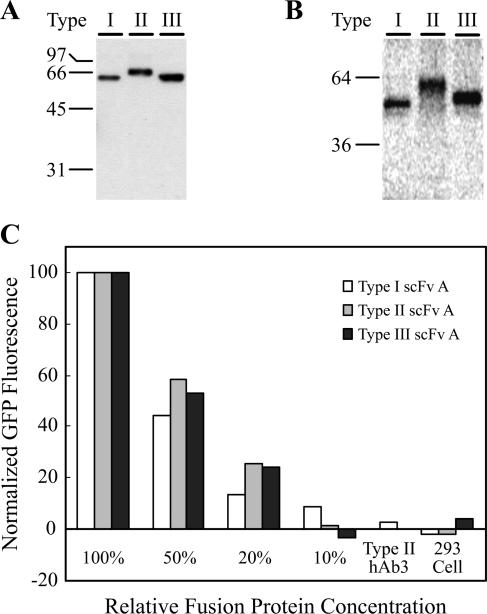
FIG. 6.
Test of GFP fusion platform using endothelial cell surface binding scFvA. (A) Western blot of equal volumes of supernatant containing scFvA fusion proteins. Molecular masses are expressed in kilodaltons. (B) Fluorescence scan of nonboiling SDS-PAGE of purified scFvA fusions. (C) Flow cytometric analysis of scFvA fusion protein binding to rat brain endothelial (RBE4) cells. Purified fusion protein was used to immunolabel the surfaces of live RBE4 cells or negative control HEK293 cells (at 100% fusion concentration), and the cell surface fluorescence was assessed by flow cytometry. The percent binding was independently normalized for each fusion type to the signal at maximum concentration (100%; ∼250 nM), and the type II hAb3 fusion protein was used at 250 nm as a negative control to indicate the specific nature of the fluorescence signal. The absolute magnitudes of the maximum fluorescent signals for each fusion type were within 20% of each other. The data are representative of triplicate independent flow cytometry experiments.

