Figure 2.

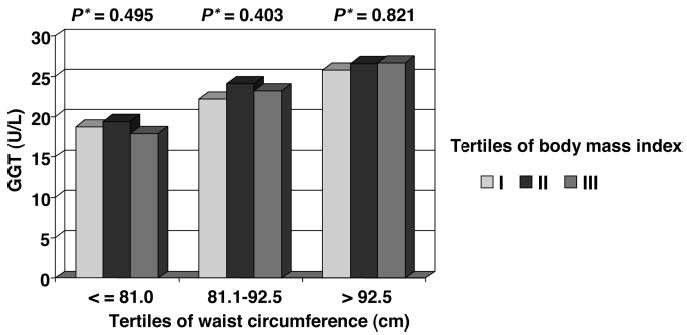
Age-adjusted GGT mean values across tertiles of BMI within each tertile of waist circumference. The Western New York Study, 1995 to 2001. *P values for linear trend across tertiles of BMI within each tertile of waist circumference.

Age-adjusted GGT mean values across tertiles of BMI within each tertile of waist circumference. The Western New York Study, 1995 to 2001. *P values for linear trend across tertiles of BMI within each tertile of waist circumference.