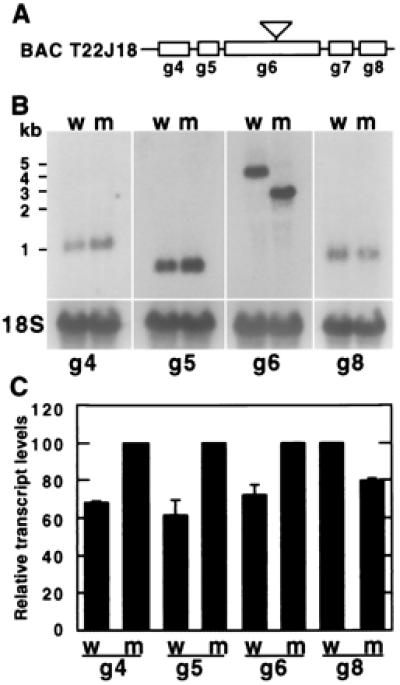
Figure 2.

Expression of GI and neighboring genes is altered in gi-100 mutant seedlings. (A) Diagrammatic representation of the insertionally tagged gi-100 gene (g6) and neighboring genes (g4, g5, g7, g8) within the sequenced BAC T22J18. The inverted triangle shows the location of the T-DNA insert in the gi-100 mutant. g4 = T22J18.4; g5 = T22J18.5; g6 = T22J18.6 (GI); g7 = T22J18.7; g8 = T22J18.8. (B) Northern blots of GI and neighboring-gene transcripts in both wild-type and gi-100 mutant seedlings. An 18S rDNA probe was used to reprobe each blot to show the amount of RNA loaded in each lane. Approximate marker sizes are shown on the left. (C) Quantification of transcript levels using a PhosphorImager. Signals for each transcript were normalized with the 18S rDNA signal and expressed as a percentage of the highest value obtained for each gene. Data are expressed as mean ± SEM (n ≥ 2).
