Figure 3.

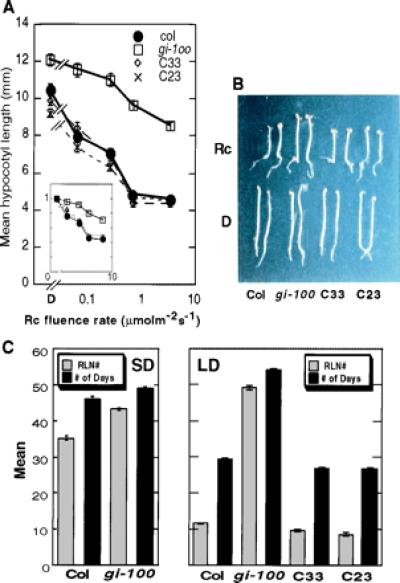
Complementation of gi-100 mutant with wild-type GI locus. (A) Fluence-rate response curves for hypocotyl lengths of two complemented lines (C33 and C23) along with wild-type (Col) and gi-100 mutant seedlings grown in darkness (D) or a range of Rc fluence rates for 3 days. Hypocotyl length expressed as percentage of dark value is shown in the inset. Data are expressed as mean ± SEM. (B) Visual phenotypes of the two complemented lines (C33 and C23), gi-100, and wild type grown either in D or in Rc (3.84 μmolm−2s−1). (C) Complementation of the gi-100 late flowering phenotype with the wild-type GI locus. Rosette leaf number (RLN#) or days were counted when the plants bolted under SD (Left; 9 h white light of 128 μmolm−2s−1 and 15 h dark) or LD (Right; 18 h white light of 62 μmolm−2s−1 and 6 h dark) at 21°C. Flowering time for the wild type (Col), gi-100 mutant and the two complemented lines (C33 and C23) are shown. Data are expressed as mean ± SEM.
