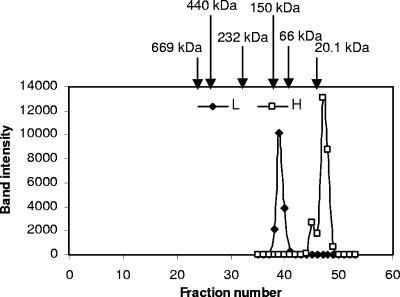
FIG. 4.
Gel filtration elution profiles of endogenous H and L proteins. An extract of purified hydrogenosomes (1.5 ml) was loaded on a Superdex 200 column and run at 0.2 ml/min. Two-milliliter fractions were collected, TCA precipitated, and subjected to 15% SDS-PAGE, followed by immunoblotting using anti-L and anti-H antibody, respectively. Band intensity was plotted against fraction number. Arrows indicate the elution profiles of marker proteins (soybean trypsin inhibitor, 20.1 kDa; bovine serum albumin, 67 kDa; alcohol dehydrogenase, 150 kDa; catalase, 232 kDa; ferritin, 440 kDa; thyroglobuin, 669 kDa;). The apparent molecular masses of native H and L proteins are 15 kDa and 100 kDa, respectively.

