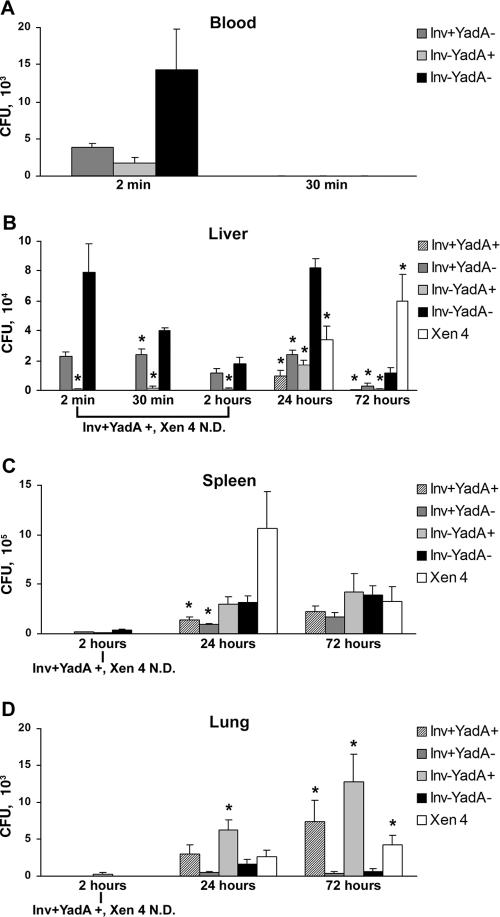
FIG. 1.
Bacteremia and tissue colonization by Y. pseudotuberculosis adhesin mutants. CFU per ml of blood (A) or gram of tissue (B to D) are shown for each strain of bacteria. Infections with strains Inv+YadA+ and Xen 4 were performed at 24 and 72 h only. N.D., not done. The data shown represent means from three to four mice for infections lasting from 2 min through 2 h and five to eight mice for infections of 24 and 72 h. Statistical analysis was performed using raw, non-normalized data. Standard errors from the mean are indicated by error bars. A two-sample t test, assuming unequal variance, was used to determine the statistical significance between condition means, with a significance level of ≤0.05. Asterisks represent a statistically significant deviation from the means relative to the Inv−YadA− strain.

