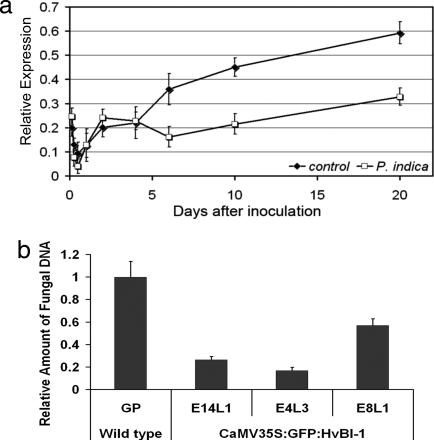
Fig. 4.
Influence of HvBI-1 on the development of P. indica in barley roots. (a) Quantitative PCR analysis of HvBI-1 expression. As compared with noncolonized roots, expression of the gene is significantly lower from 7 dai onward up to 20 dai. Error bars represent standard deviations. (b) The relative amount of P. indica DNA in transgenic GFP-HvBI-1 roots was determined at 20 dai. Error bars represent standard deviations. GP represents wild-type plants (Golden Promise). E14L1, E4L3, and E8L1 represent independent transgenic GFP-HvBI-1 GP lines, with five plants tested per line. All three lines were significantly different from the wild type (P <0.005, Student's t test). Similar results were obtained in three experiments with plants of an independent transgenic GFP-HvBI-1 line.

