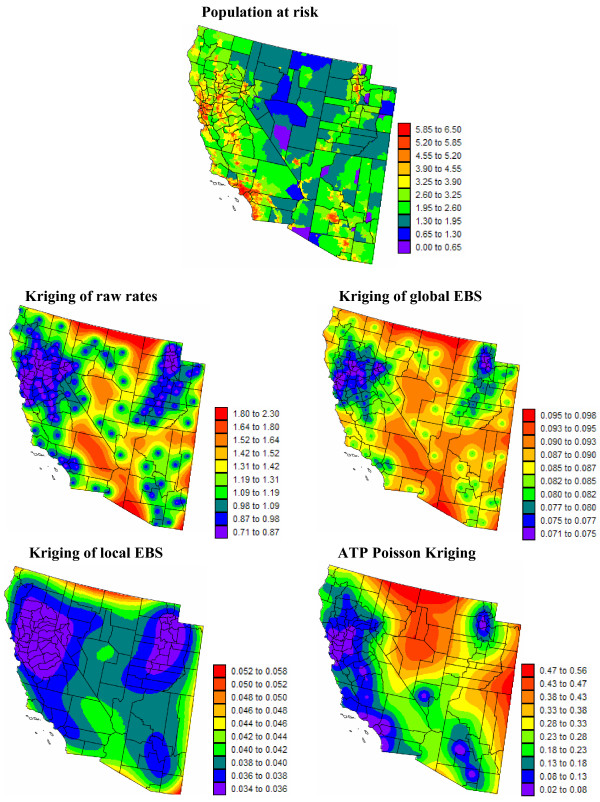
Figure 8.
White female population map for Region 2, and the prediction variance for the different forms of kriging. The fill color represents the population at risk (lognormal scale) or the kriging variance associated with the risk maps of Figure 6. The following estimation techniques were used: point kriging of raw rates, point kriging of global and local empirical Bayes smoothers (EBS), and area-to-point (ATP) Poisson kriging. The units for the kriging variance maps are (age-adjusted mortality rate per 100,000 person-years)2, and the class boundaries correspond to the deciles of the histogram of variance.

