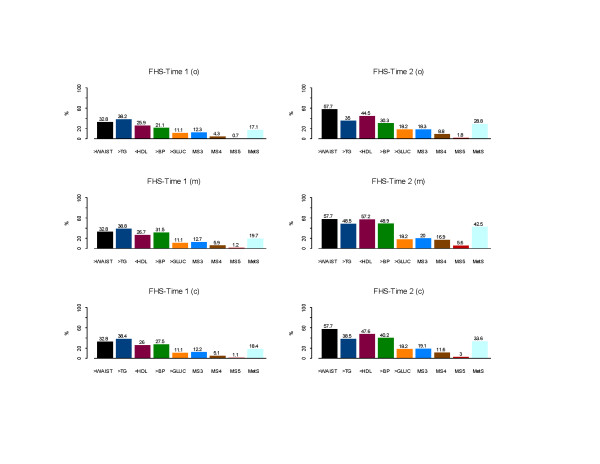
Figure 1.
Percentages of MetS and its risk factors in the FHS-Time 1 and FHS-Time 2. Three analyses were applied: FHS-T1 (o)/FHS-T2 (o) – original MetS (no medication effects on lipids were considered); FHS-T1 (m)/FHS-T2 (m) – medication effects on BP, lipids, and GLUC were considered as categorical effects; FHS-T1 (c)/FHS-T2 (c) – for participants that used anti-hypertensive/anti-hyperlipidemic medication(s), corrections of the corresponding risk factors with clinical trials medication average effects for BP and lipids were performed (see Methods). Footnote. MS3, MS4, MS5 are the percentages of participants with at least 3, 4, and 5 risk factors beyond the MetS NCEP thresholds.

