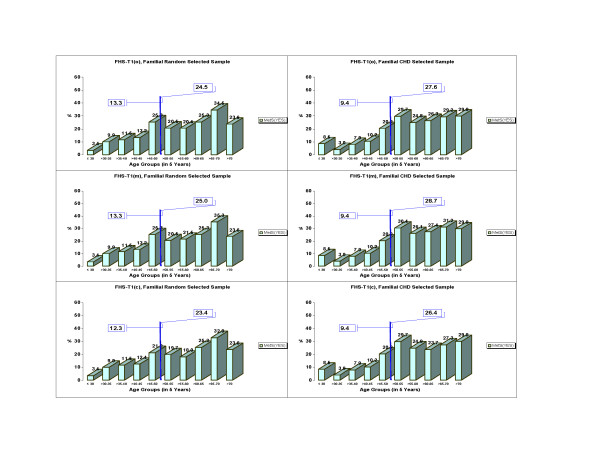
Figure 2.
Trends of MetS percentages per age groups in the FHS-Time 1 in a familial random sample and in a familial CHD selected sample. Reported are the corresponding percentages of MetS by 5 years age groups, as well as percentages of ages up to 50, 50 and older for FHS-Time 1, for (o), (m), and (c) methods (see Methods).

