
Figure 2.
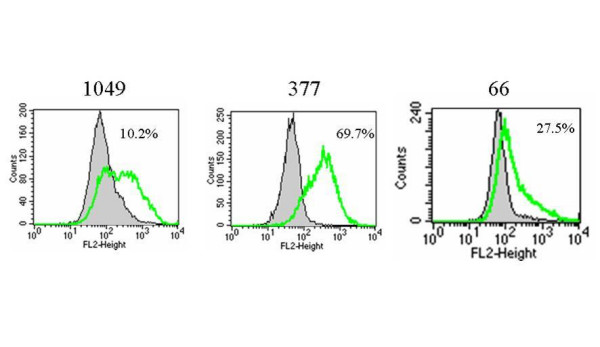
CD133 protein expression on primary cultured cells. Tumor cells were cultured in 10% FBS/DMEM/F-12 medium for 3–6 passages and stained with specific mAb to CD133, and isotype control-matched mAb. Results are given as the percentage of CD133 positive cells in the total population. In the histograms, the thick green line represents staining with CD133 mAb, and the gray lines represent the isotype control-matched mAb.