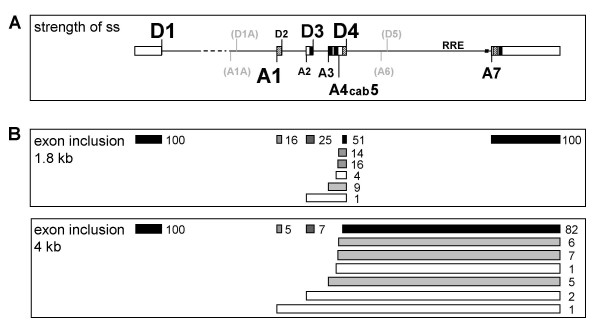
Figure 10.
Schematic overview of HIV-1 splice sites and their strength. (A) Schematic drawing of the HIV-1 pre-mRNA and the distribution of the splice sites. The relative strength of the splice sites, based on splice site swapping strategies in this and previous publications [27,29], is represented by the size of the letters. D5 and A6 (grey) are marked for better orientation but they are not used in HIV-1 NL4/3 and therefore their relative strength was not tested. D1A and A1A are recently published splice sites preferentially involved in RNA stabilization [6]. ESEs (hatched) and ESS/ISS (black) are marked. (B) Schematic drawing of the exon structure in the 1.8 kb and 4 kb HIV-1 RNA classes. The numbers represent the relative incidence of exon inclusion [%] calculated from previously published RT-PCR analyses [2]. Differences to 100% in the total amount of the possibilities of overlapping exon recognition are due to rounding errors. The darker the colour of the exons the more efficiently they are included in the alternatively spliced HIV-1 transcripts.

