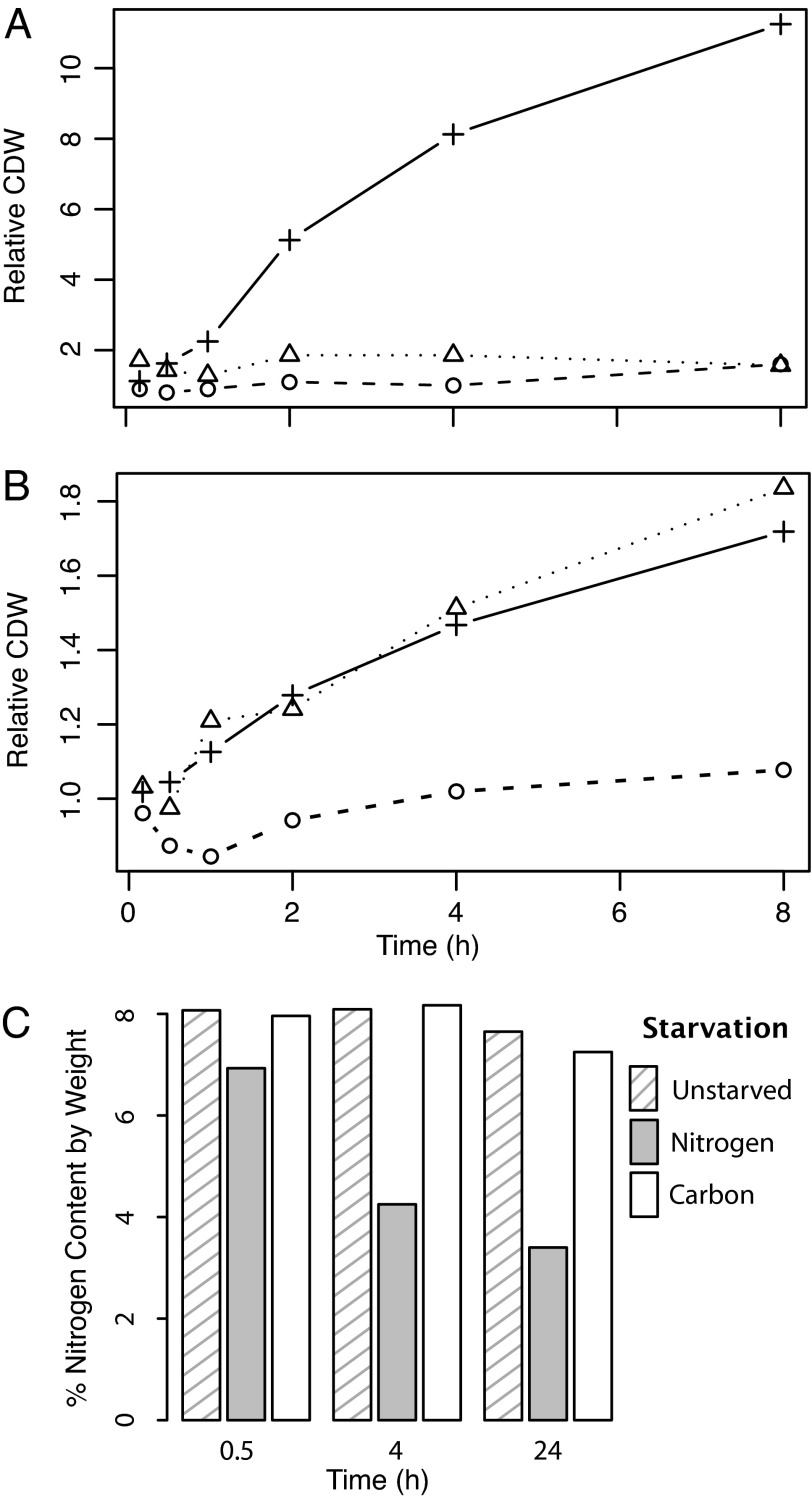
Fig. 2.
Cell growth and elemental composition response to nutrient deprivation. (A and B) Cell dry weight (CDW) is plotted relative to the starting weight, for cultures that are grown on complete minimal media (+) vs. starved for carbon (o) or for nitrogen (Δ) in E. coli (A) and S. cerevisiae (B). (C) Nitrogen content of starved yeast.

