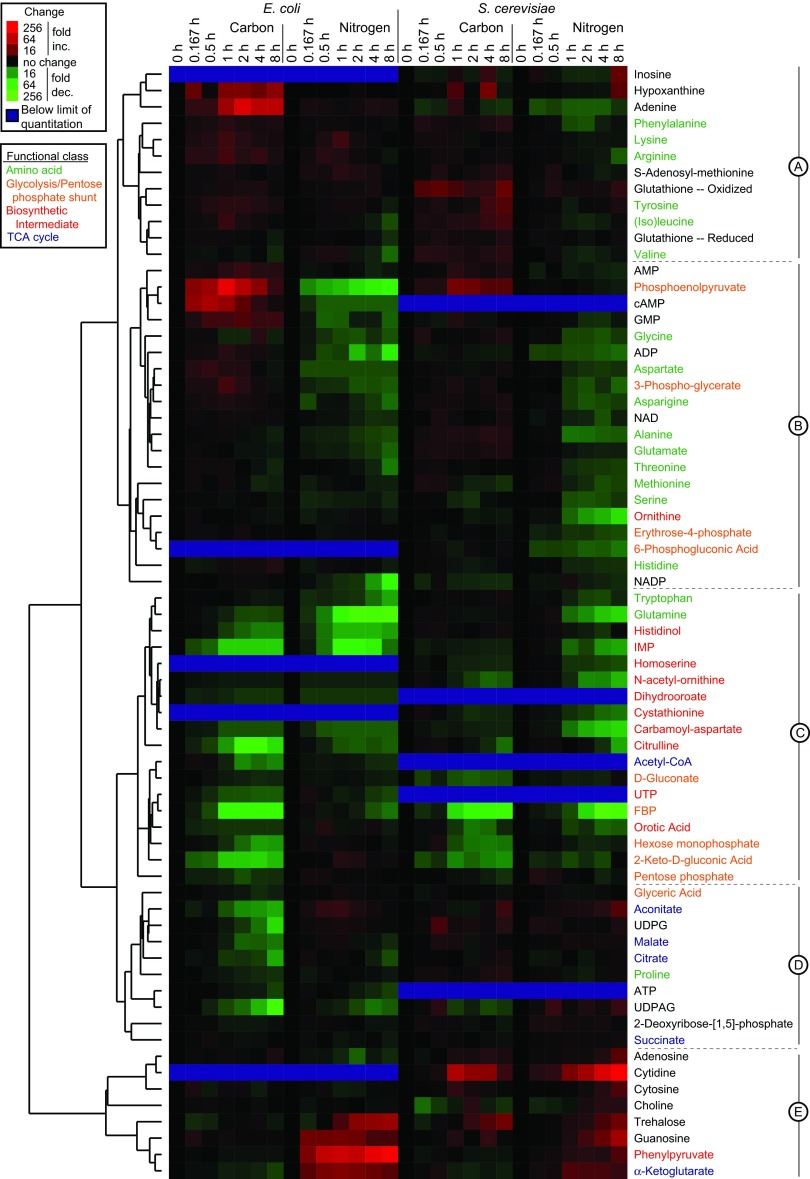
Fig. 3.
Clustered heat map of metabolome dynamics during nutrient starvation. Columns represent different starvation time points. Fold-change is relative to exponentially growing cells (t = 0). Cluster A contains 12 metabolites that tend to rise in all forms of starvation, R2 = 0.485; cluster B contains 20 metabolites that rise in carbon but fall in nitrogen starvation, R2 = 0.575; cluster C contains 18 metabolites that fall in all forms of starvation, R2 = 0.677; cluster D contains 10 metabolites that rise in yeast but all in E. coli starvation, R2 = 0.507; and cluster E contains 8 metabolites that rise in nitrogen but fall in carbon starvation, R2 = 0.248.

