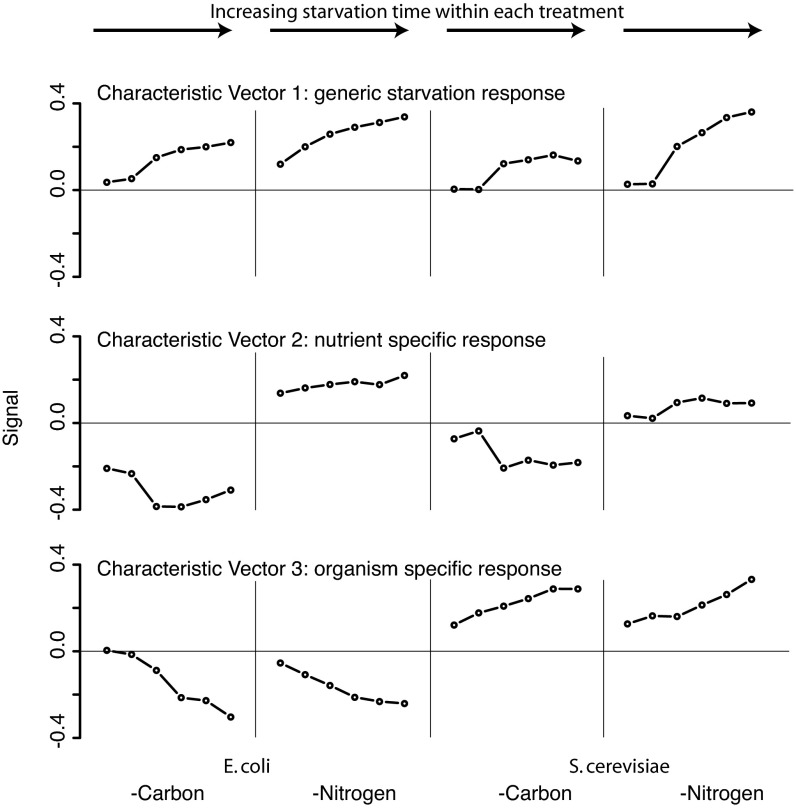
Fig. 6.
Singular value decomposition of the metabolome starvation matrix shown in Fig. 3. Each characteristic vector includes entries for each starvation time point (t = 10 and 30 min and 1, 2, 4, and 8 h) in each of the four tested starvation conditions (two nutrients times two organisms). The fraction of total information in the metabolome starvation matrix captured by the characteristic vectors is 42%, 30%, and 11% for vectors 1, 2, and 3 respectively.

