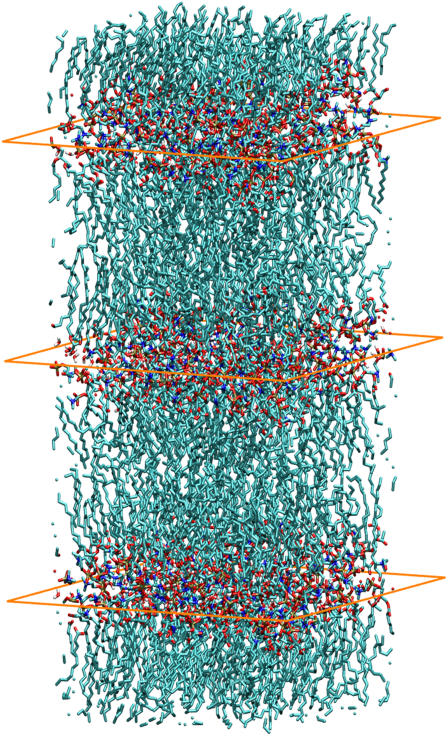
FIGURE 2.
Configuration of the multibilayer system studied. The rectangles are drawn to indicate the interfaces between the three different bilayers. Periodic boundary conditions were considered in the simulations in all three directions. (Graphical representations made with VMD (51).)

