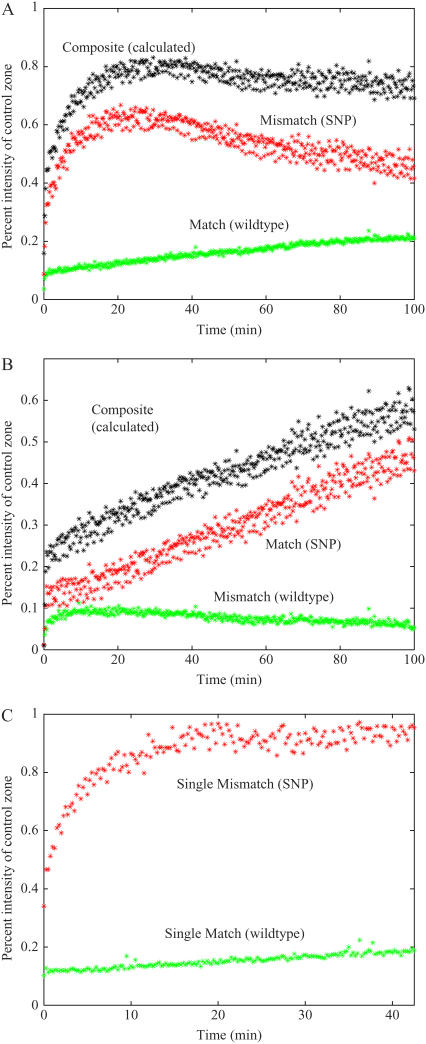
FIGURE 1.
Real-time hybridization curves for a wild-type (30 nM, green), SNP (30 nM, red), calculated composite curve (A and B) consisting of wild-type plus SNP hybridization (black). (A) Two-component sample of wild-type (match) and SNP (mismatch) showing competitive hybridization on a spot matched to the wild-type target, the composite curve decreases slightly due to probe density difference between the control spots. (B) Two-component sample of SNP (match) and wild-type (mismatch) showing competitive hybridization on a spot matched to the SNP. (C) single component traces of match and mismatch hybridization on a spot matched to the wild-type target (overlay of two independent experiments).

