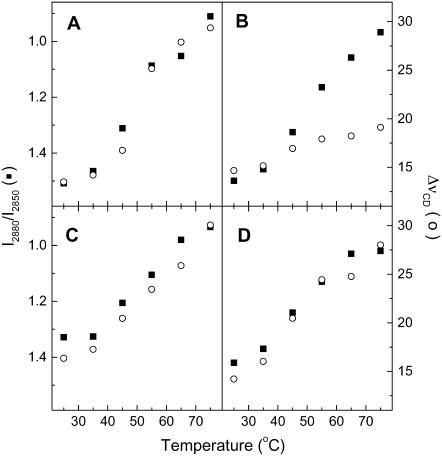
FIGURE 4.
Thermotropism of CerIII/PA-d31/sterol (1:1:1) mixtures, as probed by the I2880/I2850 intensity ratios (▪) and the ΔνCD (○) obtained from Raman spectroscopy. (A) CerIII/PA-d31/chol (1:1:1) mixtures free of Ca2+. (B) CerIII/PA-d31/chol (1:1:1) mixtures with 100 mM Ca2+. (C) CerIII/PA-d31/CS (1:1:1) mixtures free of Ca2+. (D) CerIII/PA-d31/CS (1:1:1) mixtures with 100 mM Ca2+. The two y-scales were adjusted such that a gel-to-liquid crystalline phase transition of phospholipid bilayers is represented by a variation with the same amplitude for the two parameters. Note that the I2880/I2850 scale is upside down to allow the direct comparison with the ΔνCD variations.

