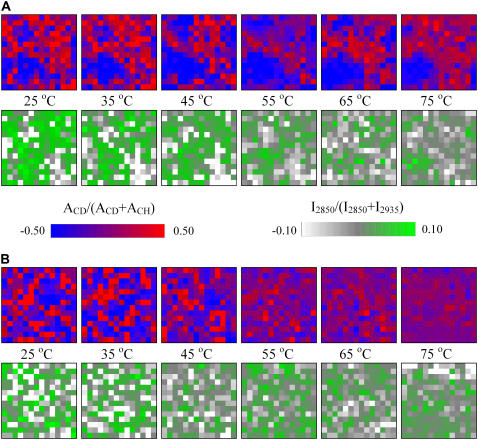
FIGURE 9.
Chemical maps representing the normalized lipid spatial distribution in the CerIII/PA-d31/sterol (1:1:1) mixtures with 100 mM Ca2+. (A) Cholesterol-containing mixture. (B) CS-containing mixture. (Top) AνCD/(AνCD + AνCH) representing the distribution of PA-d31 relative to (CerIII/PA-d31/sterol). (Bottom) I2850/(I2850 + I2935) representing the distribution of CerIII relative to (CerIII/sterol).

