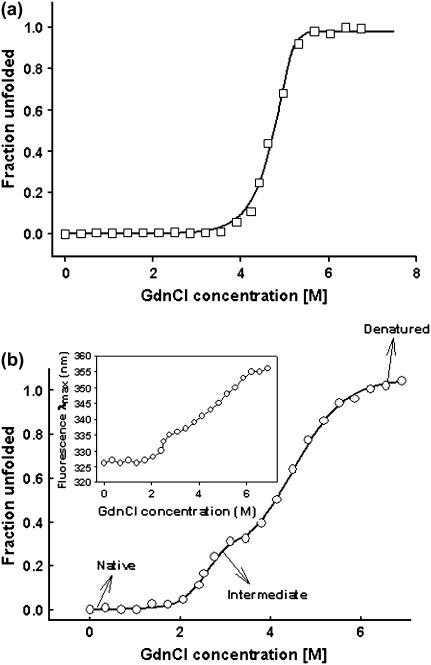
FIGURE 5.
Representative unfolding isotherms monitored by fluorescence of the two forms of soybean agglutinin. (a) Two-state denaturation of gSBA at a protein concentration of 0.8 μM at 20°C. (b) Three-state denaturation of rSBA at a protein concentration of 0.8 μM at 20°C. The fluorescence intensity at 370 nm was used as a probe to monitor the denaturation. (Inset) The change in fluorescence emission (λmax) of rSBA with increase in the denaturant concentration.

