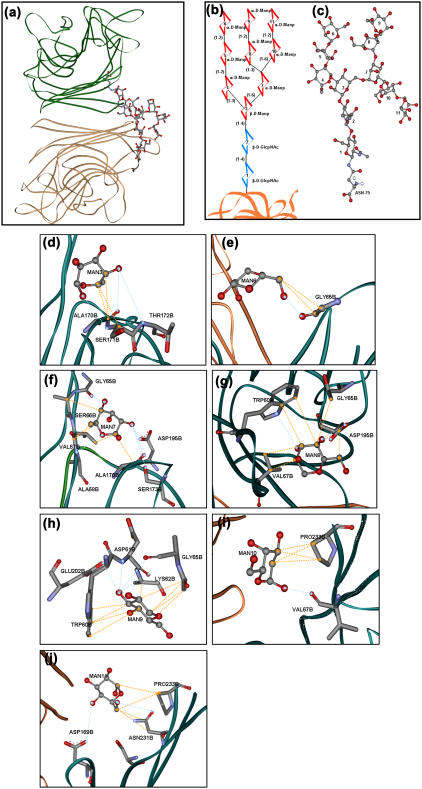
FIGURE 7.
Glycans-protein interactions. (a) A dimer of gSBA showing the mutual disposition of the glycans chain with respect to the subunits. (b) Primary sequence of the oligomannose in gSBA. (c) Tertiary structure of the oligomannose chain. (d–j) Interactions of the individual mannose residues (as per the numbering in Fig. 7 a) with the protein. The interactions were assessed using the LPC software and figures were made in ViewerLite42 software. The blue dashed lines represent hydrogen-bonding interactions, whereas the orange dashed lines represent hydrophobic interactions.

