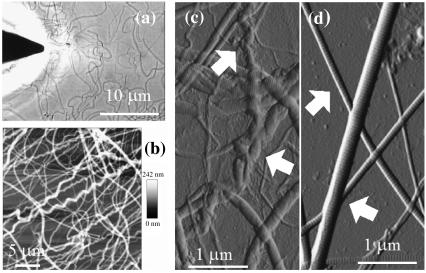
FIGURE 1.
Atomic force microscopy of collagen fibrils. (a) Optical image showing the AFM tip above a sample of collagen fibrils on a glass slide (JPK Nanowizard). Scale bar, 10 μm. (b and c) Contact mode AFM images of digital tendon collagen fibrils. The AFM height (b; height range 0–242 nm) and error signal (deflection) (c) images show diversity in fibril morphology with several fibrils showing significant crimp (spiral morphology) along their length (arrowed in c), others retaining a straighter appearance; all display conserved axial D-banding. Scale bars = 5 μm (b) and 1 μm (c). (d) Contact mode AFM error signal image of rat tail collagen fibrils (scale bar, 1 μm). The fibrils are straighter (arrows) than those in (b and c) and display a similar D-banding size.

