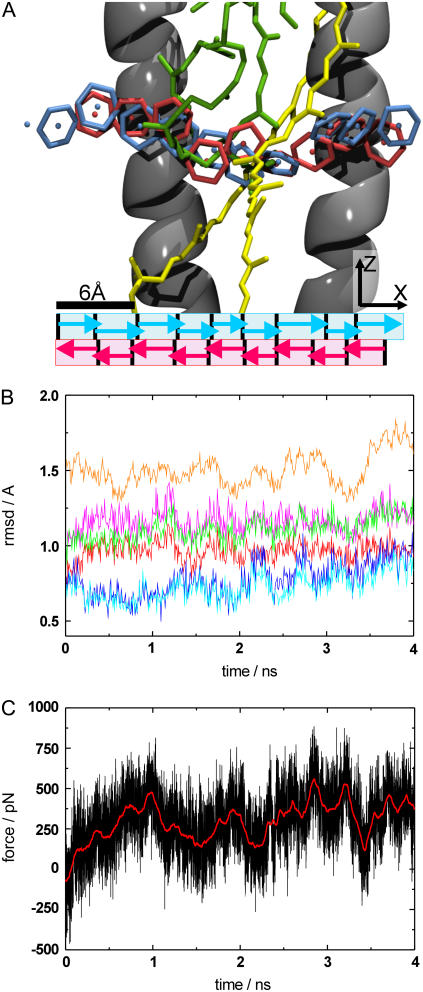
FIGURE 2.
(A) Snapshots of the pathway of ubiquinone diffusion through the LH1 ring (side view). Parts of the protein/pigments are omitted for clarity. The protein is shown in cartoon representation in gray, with BChl molecules in green and Car molecules in yellow. The ubiquinone head (center of gravity of headgroup denoted by spheres) is shown in blue for the forward and red for the backward simulations. The different pulling sections are marked below by arrows. (B) RMSD plot of the SMD simulation for pulling the ubiquinone molecule through the LH1 ring. Different substructures are shown. The RMSD for the backbone atoms of the α-subunit is shown in red (helical part)/magenta (all atoms), the RMSD for the backbone atoms of the β-subunit is shown in blue (helical part)/cyan (all atoms), the RMSD of all the protein backbone atoms is shown in orange, and the RMSD for the transmembrane atoms is shown in green. (C) Force curve for the same simulation. The simulation data is shown in black, with a smoothed force curve shown in red to highlight the overall shape.

