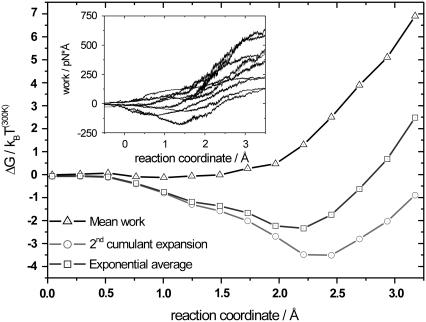
FIGURE 3.
Reconstructed potential of mean force for section 3 (backward pulling direction), calculated from the work profiles shown in the inset, using three different free-energy estimators. The mean work is represented by triangles, the second-order cumulant expansion by circles, and the exponential average by squares. Up to 2 Å, the exponential average and the second-order cumulant expansion show comparable results, with Wdiss <3 kBT(300K), meaning that the system is still sufficiently close to equilibrium. At the end of the section, the dissipative work is <8 kBT(300K). Here, both exponential average and second-order cumulant expansion show different results. The work profiles in the inset are smoothed for clarity.

