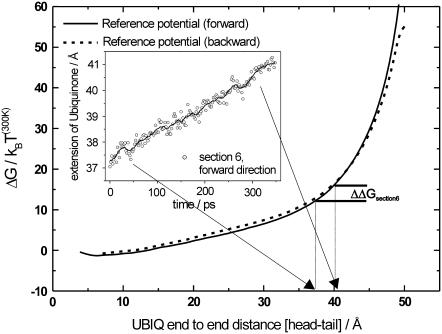
FIGURE 4.
Free-energy profile for stretching the ubiquinone molecule. The solid line denotes the forward pulling direction and the dotted line the backward direction. Mean additional ubiquinone extension data is extracted from SMD simulations of the individual PMF sections. This is shown for pulling section 6 of the forward pulling direction in the inset. Here, for example, the ubiquinone molecule is additionally stretched by ∼3 Å during the simulation, corresponding to a maximum ΔΔG of ∼4 kBT(300K) at the end of the pulling section. Different pulling sections show different entropic contributions due to different starting structures of the ubiquinone molecule. The contribution along the pulling section is subtracted from the PMF. This is done for all sections for both pulling directions independently.

