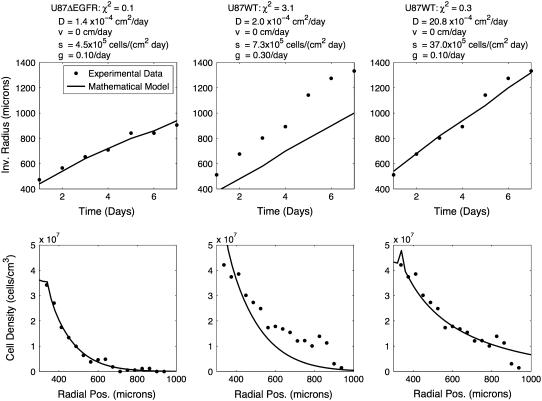
FIGURE 3.
U87ΔEGFR can be well described by unbiased motility alone, while U87WT cannot. The mathematical model (line) with only unbiased motion (vi = 0) was optimized to fit the experimental data (dots) for the two cell lines. Each column uses a different set of parameters, given at the top of the column. The first column is fit to the U87ΔEGFR data and the second and third are fit to the U87WT data. Note that in column 2, D is at the maximum value it can take in the constrained optimization. Loosening the restrictions on D gave a better fit to the data, as shown in column 3, but here D is 10 times larger than is reasonable.

