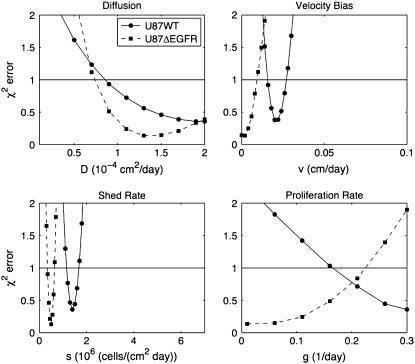
FIGURE 5.
Sensitivity Analysis 1. In each plot, one parameter is varied while the other three remain fixed at their optimal values from Fig. 4. Notice that the model is sensitive to all four parameters. The horizontal line indicates where χ2 = 1. Below this line, the fit to the data is considered good.

