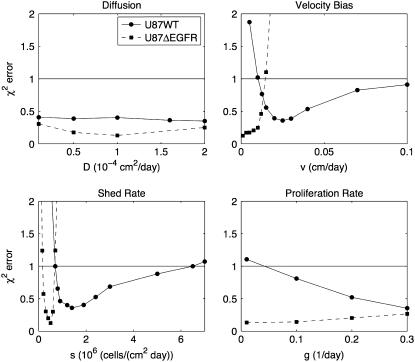
FIGURE 6.
Sensitivity Analysis 2. In each plot, one parameter is fixed at different values while the other three are optimized to minimize error. This analysis is used to generate revised estimates of the original parameter bounds, shown in Table 1. Notice that the shed rate and velocity bias for the U87WT cell line were significantly higher than for the U87ΔEGFR. The horizontal line indicates where χ2 = 1. Below this line, the fit to the data is considered good.

