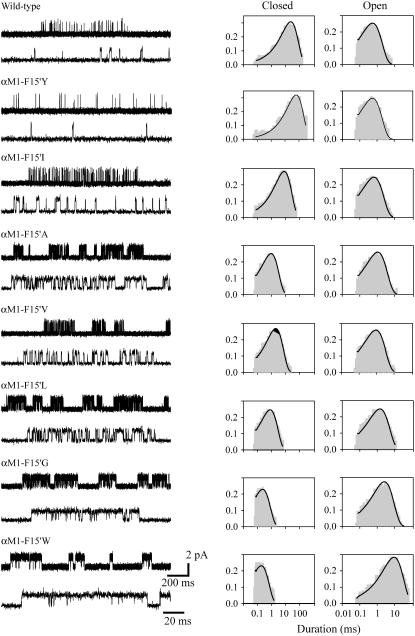
FIGURE 3.
Single-channel recordings of AChRs mutated at 15′ of αM1 activated by 20 mM choline. (Left) Single-channel recordings showing clusters at two different timescales. Membrane potential: −70 mV. Openings are shown as upward deflections at a bandwidth of 5 kHz. (Right) Open- and closed-time histograms with the fit by Scheme 1 superimposed to the experimental histograms. Histograms were constructed with the selected clusters. Ordinates correspond to the square root of the fraction of events per bin.

