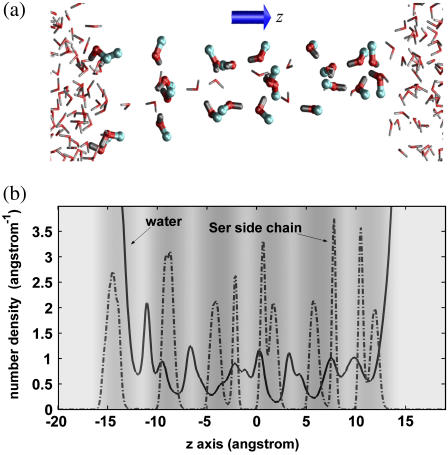
FIGURE 5.
Distributions of the pore water and Ser side chains along the z axis. Panel a is an MD snapshot, illustrating the distribution of the water molecules and the Ser side chains. The hydrogen, oxygen, and carbon atoms are in gray, red, and blue, respectively. Panel b are the number-density profiles for the oxygen atoms of the pore water and the Ser side chains, respectively. The gray-scale background of panel b indicates the pore radius profile with their values given by the gray-scale bar as in Fig. 2.

