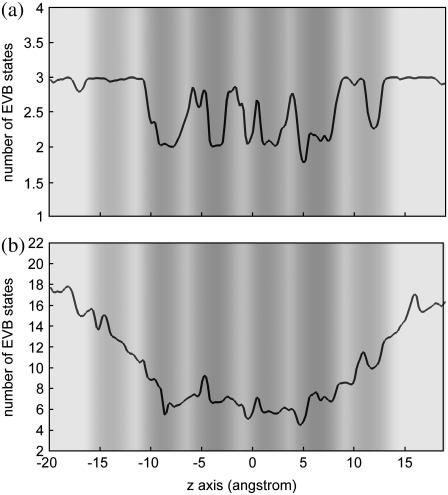
FIGURE 7.
Number of MS-EVB states as a function of the z axis for the first solvation shell (a) and for the first three solvation shells (b). The statistical uncertainties are ∼0.5 for (a) and 1 for (b). The background gray scale represents the pore radius profile (see the gray-scale bar in Fig. 2).

