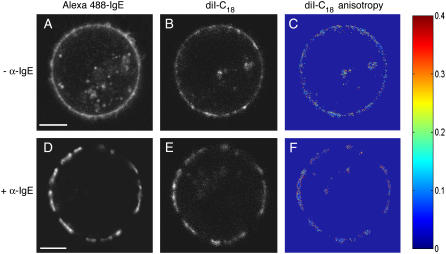
FIGURE 1.
Confocal fluorescence imaging and steady-state fluorescence anisotropy imaging of RBL-2H3 cells. diI-C18 (λex = 543 nm) in the plasma membrane (B and E) colocalizes with A488-IgE (λex = 488 nm) on the cell surface (A and D) upon extensive cross-linking by α-IgE. Steady-state anisotropy images of diI-C18 (C and F) are shown in the absence or presence of α-IgE, respectively. Higher anisotropy, or membrane order, increases toward the red end of the color scale. Bar, 5 μm.

