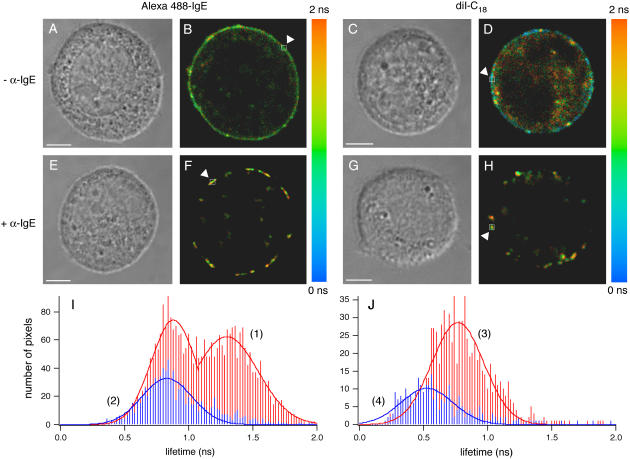
FIGURE 2.
2P-FLIM of RBL-2H3 cells. Representative 2P-FLIM images of diI-C18 (D and H) and A488-IgE (B and F) in the plasma membrane of cells that have been cross-linked (F and H) with α-IgE or not (B and D) (λex = 760 nm). The average lifetime (〈τfl〉, indicated by the color scale) was determined by fitting the lifetime decays at the pixels (binning factor = 1) highlighted by arrows, yielding A488-IgE (− α-IgE) = 1.14 ± 0.09 ns; A488-IgE (+ α-IgE) = 1.34 ± 0.03 ns; diI-C18 (− α-IgE) = 0.57 ± 0.04 ns; and diI-C18 (+ α-IgE) = 0.71 ± 0.03 ns. Corresponding DIC images (A, C, E, and G) show cell viability after 2P-FLIM. Histograms demonstrate an increase in the average lifetime distributions of diI-C18 (J) and A488-IgE (I) that occur for cells upon cross-linking (curves 1 and 3) versus uncross-linked cells (curves 2 and 4). The free fluorescent markers in solution decay as a single exponential with average lifetimes of 0.43 ± 0.04 ns (n = 3) for 10 μM diI-C18 in DMSO and 3.1 ± 0.2 ns (n = 3) for 10 μM A488 in water (images not shown). Bar, 5 μm.

