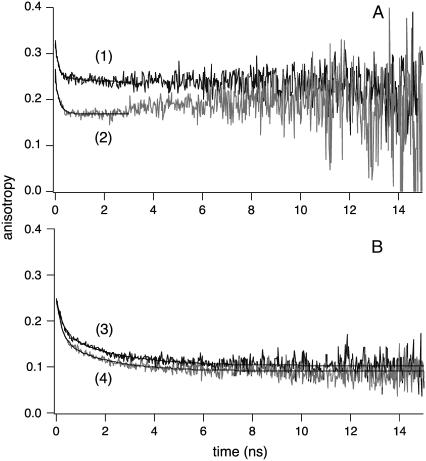
FIGURE 4.
1P time-resolved fluorescence anisotropy of diI-C18 and A488-IgE in living mast cells, under different conditions of IgE cross-linking. Representative single-point time-resolved anisotropy decays of diI-C18 (A) in the plasma membrane of mast cells with (curve 1) or without (curve 2) IgE cross-linking and A488-IgE (B) on the surface of cells in the presence (curve 3) or absence (curve 4) of α-IgE (λex = 480 nm for both diI-C18 and A488-IgE). Curves were fit, following Eq. 2, as a single (diI-C18 labeled cells) or biexponential (A488-IgE labeled cells), both with an additional residual anisotropy component. Points of the decays at times well beyond the excited state lifetime of the probe where noise levels were high (3 ns for diI-C18) were not included in the fit. The fit parameters of time-resolved fluorescence anisotropy decays are summarized in Table 2. The observed associated-anisotropy feature (47) in diI-C18 without cross-linking was not reproducible in all our measurements and may be attributed to the low signal/noise at times much longer than the excited-state lifetime (see Fig. 3).

