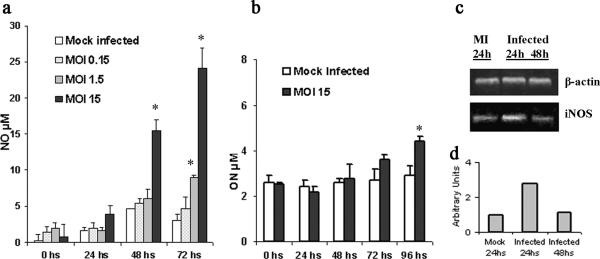
FIG. 2.
Effect of Chlamydia infection on NO production. (a) Nitrite concentrations at various times postinfection from MAT-LU cells following mock infection or infection with different MOIs of C. muridarum. (b) NO concentrations at various times postinfection from PPEC cells infected with C. muridarum (MOI of 15). (c) Qualitative RT-PCR analysis of iNOS and β-actin mRNA. MAT-LU cell monolayers infected with 15 IFU/cell of C. muridarum. Total RNA was extracted at the indicated times after infection. (d) Semiquantitation of iNOS-specific mRNA in infected and mock-infected MAT-LU cells (see Materials and Methods). Errors bars represent standard deviations of triplicate assays. Significant differences are indicated with asterisks (P < 0.05). Figures are representative of at least three experiments performed. MI, mock infected.

