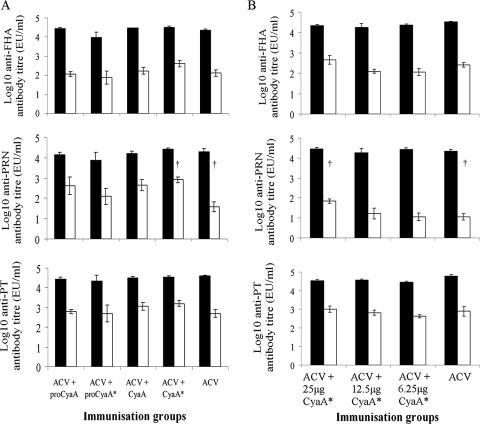
FIG. 2.
IgG1 (black bars) and IgG2a (white bars) antibody levels from mice immunized with (A) ACV, with or without different CyaA forms, or (B) ACV, with or without graded doses of CyaA*. A description of the immunization procedures is given in the legend to Fig. 1. Sera for antibody determinations were obtained on day 42. Results represent the mean antibody titers for five mice per group plus the SEM (error bars). †, P < 0.05 (IgG2a for ACV-plus-CyaA* group [25 μg] versus IgG2a for ACV group [Student's t test]).

