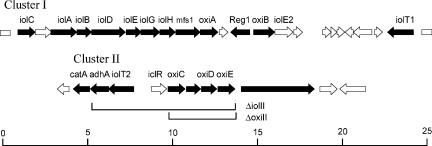
FIG. 3.
Genome maps of the C. glutamicum regions functioning in myo-inositol catabolism. Cluster I shows the genome organization of the nucleotide sequence from 167,768 to 193,453, and cluster II shows the sequence from 3,257,372 to 3,272,564 of the C. glutamicum genome NC_003450. Genes exhibiting a ≥2.8-fold increase in the mRNA ratio during growth on myo-inositol compared to glucose are in black. Below cluster II, the two genomic deletions ΔoxiII and ΔiolII, respectively, are indicated. The values on the scale bar are in kilobases.

