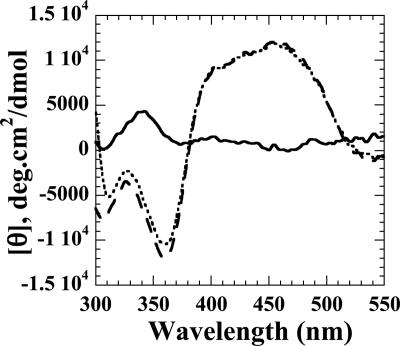
FIG. 4.
Visible CD spectra for FMN in the absence and presence of SsuE and SsuD. The spectrum of FMN (solid line) was obtained with 20 μM FMN in 25 mM potassium phosphate buffer (2.0-ml total volume) (pH 7.5), 10% glycerol, and 100 mM NaCl at 25°C. The FMN/SsuE spectrum (dashed line) was obtained with 40 nmol of FMN and 20 μM of SsuE in 25 mM potassium phosphate buffer (2.0-ml total volume) (pH 7.5), 10% glycerol, and 100 mM NaCl at 25°C. The FMN/SsuE/SsuD spectrum (dotted line) was obtained with a 1:1 stoichiometric addition of 20 μM SsuD to 40 μM FMN-bound SsuE (2.0-ml total volume). Measurements were taken in 0.2-nm increments from 550 to 300 nm in a 1-cm-path-length cuvette. Each spectrum is the average of eight scans; smoothing of the data was performed using the default parameters within the Jasco J-720 software.

