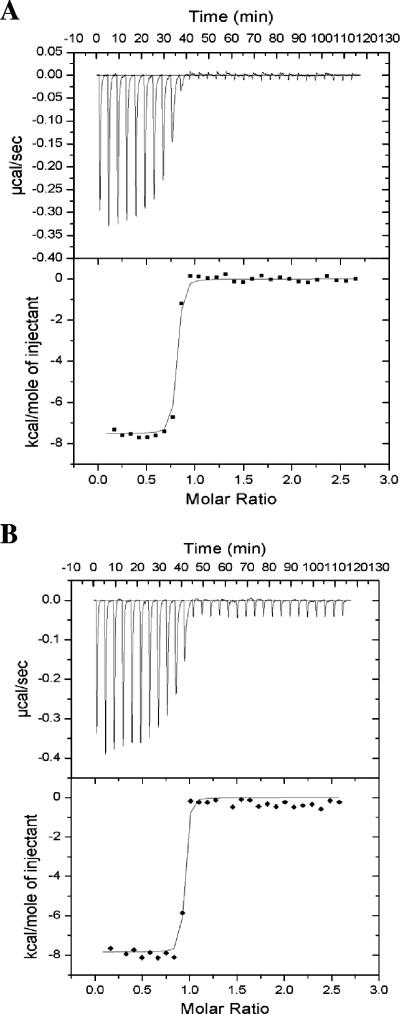
FIG. 2.
ITC analysis of TraR interaction with (A) TraM2 and (B) TraM. ITC experiments were performed at 25°C by 30 injections of 10 μl of TraR (172 μM) into 1.4 ml of TraM2 (1.47 μM) or TraM (1.47 μM), with 4-min intervals. The protein samples were in buffer containing 50 mM HEPES, pH 7.5, 200 mM NaCl, and 0.5 mM EDTA. Top panels, each peak represents a single injection, and a negative injection peak indicates that the reaction is exothermic; bottom panels, the area enclosed within each peak is integrated and is represented by ▪ or ♦. The data were then fit into a single-site binding model (shown in line), and thermodynamic parameters (ΔH, Kd, and binding stoichiometry n) were derived.

