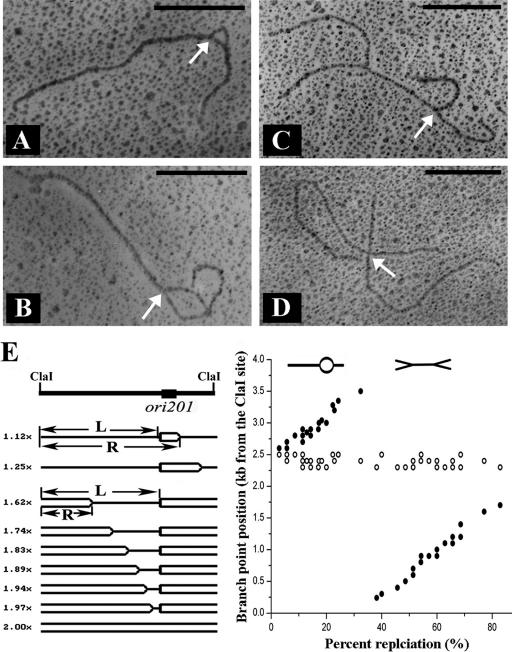
FIG. 6.
Analysis of ClaI-cleaved RIs of pSCM201 by electron microscopy. (A and B) Replication bubble-shaped molecules of pSCM201. (C) Double-Y-shaped molecule of pSCM201. (D) X-shaped molecule of pSCM201. The bars correspond to 1.0 kb. The white arrows indicate the replication initiation point. (E) Analysis of the branch-point positions of the replication forks in the pSCM201 RIs. (Left) The pSCM201 RIs were schematically ordered by increasing extent of replication (one line indicates an unreplicated region; two lines indicate a replicated region). The positions of left-hand (L) and right-hand (R) branch points were measured relative to the same ClaI site. (Right) Positions of the left-hand (white circles) or right-hand (black circles) branch points are plotted versus the extent of replication.

