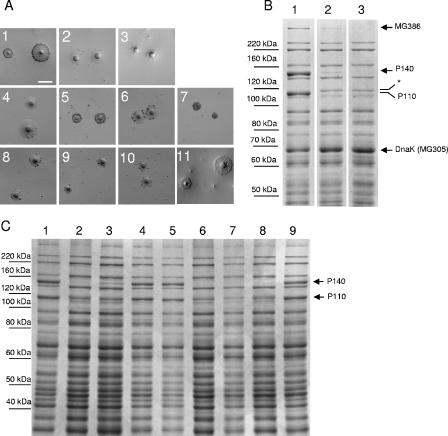
FIG. 3.
(A) Qualitative HA assessment of the different mutants and the WT strain. Panels 1 to 3, WT strain, mg192− mutant (clone 1), and mg191− mutant (clone 3), respectively. Panels 4 to 7, class I mutant, class I mutant plus pTnTetMG192, class I mutant plus pTnTetMG191, and class I mutant plus pTnTetMG191-192, respectively. Panels 8 to 11, class II mutant, class II mutant plus pTnTetMG192, class II mutant plus pTnTetMG191, and class II mutant plus pTnTetMG191-192, respectively. Bar, 100 μm. (B) SDS-8% PAGE protein profiles of the WT strain (lane 1) and the mg192− (clone 1) and mg191− (clone 3) mutants (lanes 2 and 3, respectively). Arrows show the differences observed between WT and mutant strains. *, new 115-kDa band. (C) SDS-8% PAGE protein profiles of the WT strain (lane 1), class I mutant (lane 2), class I mutant plus pTnTetMG191 (lane 3), class I mutant plus pTnTetMG192 (lane 4), class I mutant plus pTnTetMG191-192 (lane 5), class II mutant (lane 6), class II mutant plus pTnTetMG191 (lane 7), class II mutant plus pTnTetMG192 (lane 8), and class II mutant plus pTnTetMG191-192 (lane 9).

