
Fig. 1.
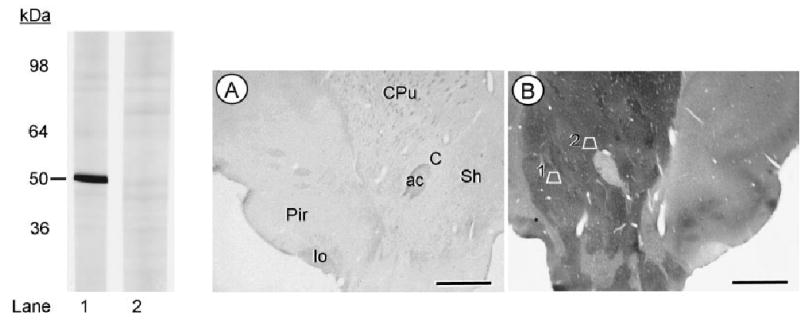
D2-antiserum characterization as seen in Western immu-noblots of rat brain membranes and immunolabeling in sections of brain tissue. In the left panel, lane 1 shows a single band at 50 kDa recognized by the D2 antiserum. In lane 2, preadsorption with immobilized antigen completely blocks detection of the D2 receptor band. Adsorption control (A) and immunoperoxidase labeling for the D2 antiserum (B) is seen in photomicrographs showing the ventral quadrant of sections through the rat brain at the level of plate 11 in the rat atlas of Paxinos and Watson (1986). The anatomical regions are identified in the control section, but equally visible in the matched section showing intense immunoperoxidase labeling in both the ventral portion of the caudate-putamen nucleus (CPu) and the nucleus accumbens core (C) and shell (Sh). Trapezoid 1 in the Acb shell and trapezoid 2 in the Acb core correspond to those regions that were sampled for electron microscopic analysis. Scale bars = 2 mm.