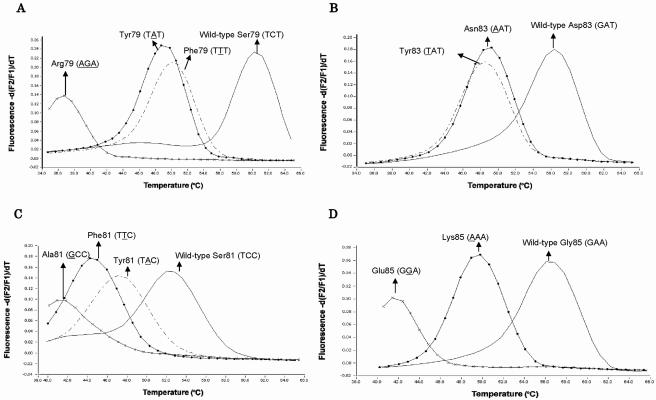
FIG. 1.
Melting peak patterns for QRDR mutants with substitutions in parC and gyrA. Melting curve analysis was performed with the 246-bp amplicon of the parC gene and the 225-bp amplicon of the gyrA gene obtained by real-time PCR from wild-type and mutant control strains. Panels A, B, C, and D show melting peak patterns for codon 79 of the parC gene, codon 83 of the parC gene, codon 81 of the gyrA gene, and codon 85 of the gyrA gene, respectively. Each value on the y axis represents the ratio of the first negative derivative of the change in fluorescence (dF) to the variation in temperature. Point mismatches in the QRDRs resulted in lower Tm values for mutant strains than for the wild-type strain.

