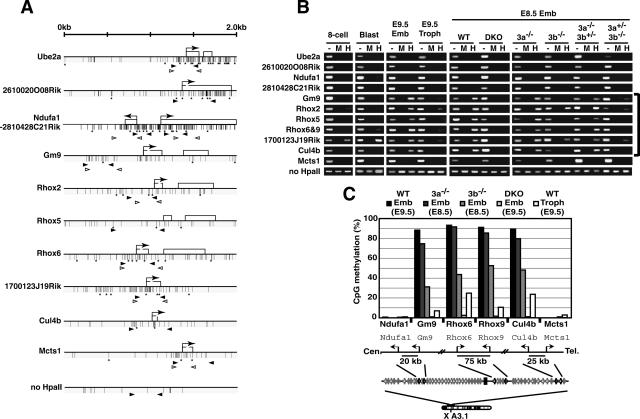
Figure 5.
Dnmt3-dependent CpG-island methylation of genes within a large genomic region around the Rhox cluster. (A) Schematic maps of the genes used for DNA methylation analysis on mouse chromosome X A3.1. Each map represents a 2-kb genomic region around the transcription start site (arrow) with CpG islands except for Rhox5, in which a genomic region around exon 2 (a transcription start site in the epididymis) is shown. Exons are represented as open boxes. Vertical bars and asterisks indicate CpG and HpaII sites, respectively. Black and white arrowheads represent the primers for HpaII-digestion PCR or for bisulfite sequencing, respectively. (B) DNA methylation profiles of the genomic region around the Rhox cluster obtained by HpaII-digestion PCR. Genomic DNA from the blastocyst, E8.5 or E9.5 embryo proper, or trophoblast was digested with HpaII and was subjected to PCR. (Lane —) Undigested DNA. (Lane M) MspI-digested DNA. (Lane H) HpaII-digested DNA. A region lacking an HpaII site on chromosome 10 (no HpaII) served as a loading control. (8-cell) Eight-cell embryos; (Blast) blastocyst; (Emb) embryo proper; (Troph) trophoblast; (WT) wild type; (DKO) Dnmt3a−/− Dnmt3b−/−; (3a−/−) Dnmt3a−/−; (3b−/−) Dnmt3b−/−; (3a−/−3b+/−) Dnmt3a−/− Dnmt3b+/−; (3a+/−3b−/−) Dnmt3a+/− Dnmt3b−/−. (C) DNA methylation states of Ndufa1, Gm9, Rhox6, Rhox9, Cul4b, and Mcts1 in the embryo proper of wild-type and Dnmt3-mutant embryos and wild-type trophoblast by bisulfite sequencing. The graph indicates the percentage of total CpG sites that were methylated in the bisulfite-sequenced clones of each analyzed region. The results for Rhox6 and Rhox9 are based on the data shown in Figure 2. A schematic drawing of the regions around these six genes is shown below, indicating the locations and selected distances between their transcriptional start sites. Additional and detailed results are provided in Supplementary Figure 2.

