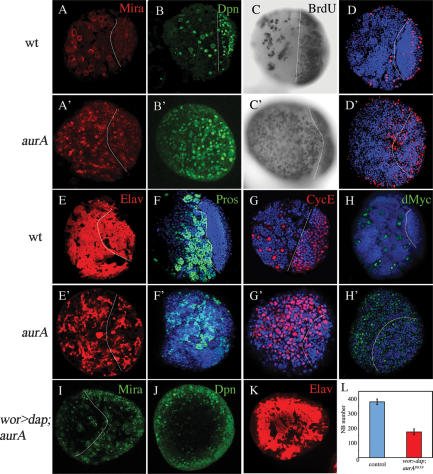
Figure 2.
AurA acts to suppress self-renewal and promote neuronal differentiation. (A–H′), Confocal single-scanning images of wild-type (A–G) and aurA mutant (A′–G′) larval brains at 96 h ALH stained with NB markers Mira (A,A′, in red), Dpn (B,B′, in green), BrdU incorporation and labeling (C,C′, in black), phospho-Histone H3 (D,D′, in red), neuronal marker Elav (E,E′, in red), nuclear Pros (F,F′, in green), and CycE (G,G′, in red). (H,H′), The number of dMyc-expressing cells is increased in aurA mutant (H′, in green) compared with wild type (H, in green). (I–L) NB overgrowth is dependent on CDK2/CycE activity. UAS-dap; aurA8839 (data not shown) and wor-Gal4, UAS-dap (wor > dap); aurA8839 brains at 96 h ALH were stained with Mira (I, in green), Dpn (J, in green), and Elav (K, in red). (L) Quantification of NB numbers in UAS-dap; aurA8839 (control) and wor > dap; aurA8839 brains at 96 h ALH. n = 20 for each genotype. In panels that contain both central brain and optic lobe, the approximate margin between the two regions is marked by a dashed line with the central brain region to the left and optic lobe to the right (optic lobe NBs are smaller than central brain NBs). Note that in aurA mutants, both regions are enlarged compared with wild type. Posterior brain regions are imaged in all panels.

