
Figure 1. Geometry, models and waveforms.
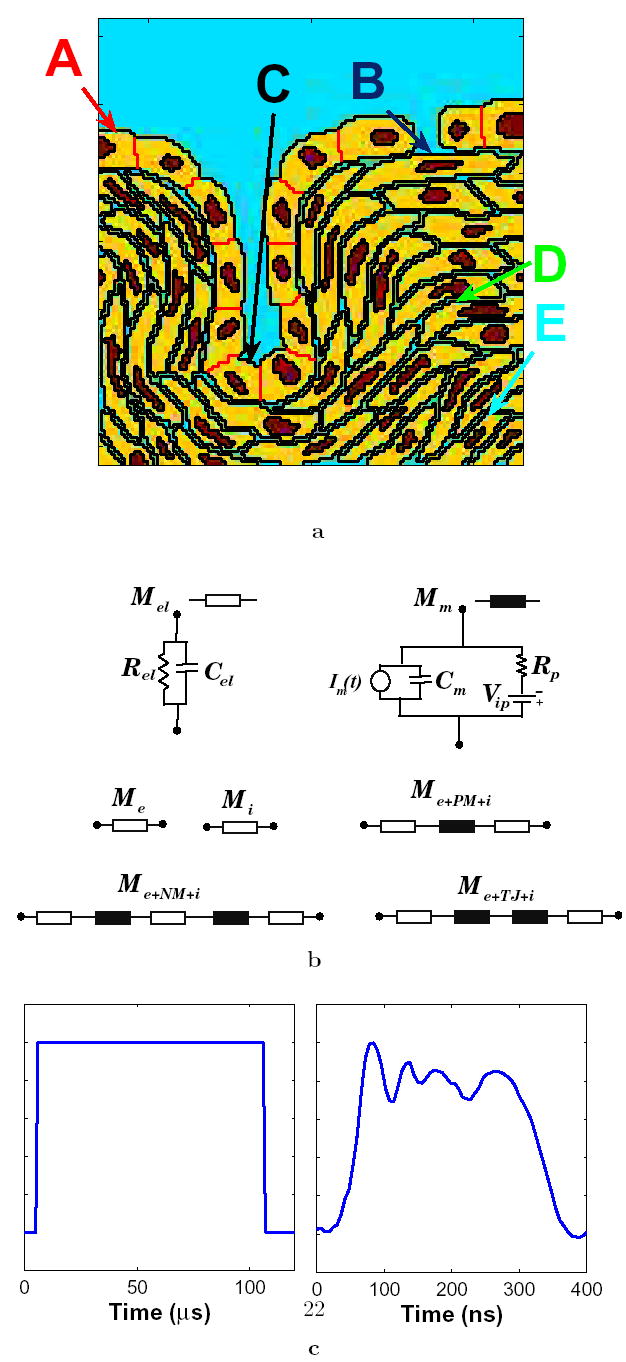
(a) Annotated geometry of the didactic multicellular model of a region of tissue [9]. The multicellular system has a row of cells with tight junctions including a gap in the cell layer. The tight junction layer forms an invagination. The underlying cells are separated by 15% interstitial space. The extracellular electrolyte is shown in blue, the nuclei in red, the cells in yellow and the tight junctions in black. The annotation refers to the five sites used in transmembrane voltage and pore density plots of Fig. 6. (b) Functional local models that represent electrolyte (Mel) and membrane (Mm) in the 131 × 131 transport lattice. Transport lattice elements that represent the extracellular medium and cytosol, plasma membrane-electrolyte interface, nuclear membrane-electrolyte interface, and tight junction-electrolyte interface are shown. Details of these local models are described elsewhere [9, 21, 25]. (c) Pulse waveform shapes used here: trapezoidal pulse of 100 μs with 1 μs rise and fall times, and an irregularly shaped 300 ns experimental pulse waveform [2].