
Figure 5. Temporal response for the supra-EP pulse at a strength of 20 kV/cm (Fig. 1c).
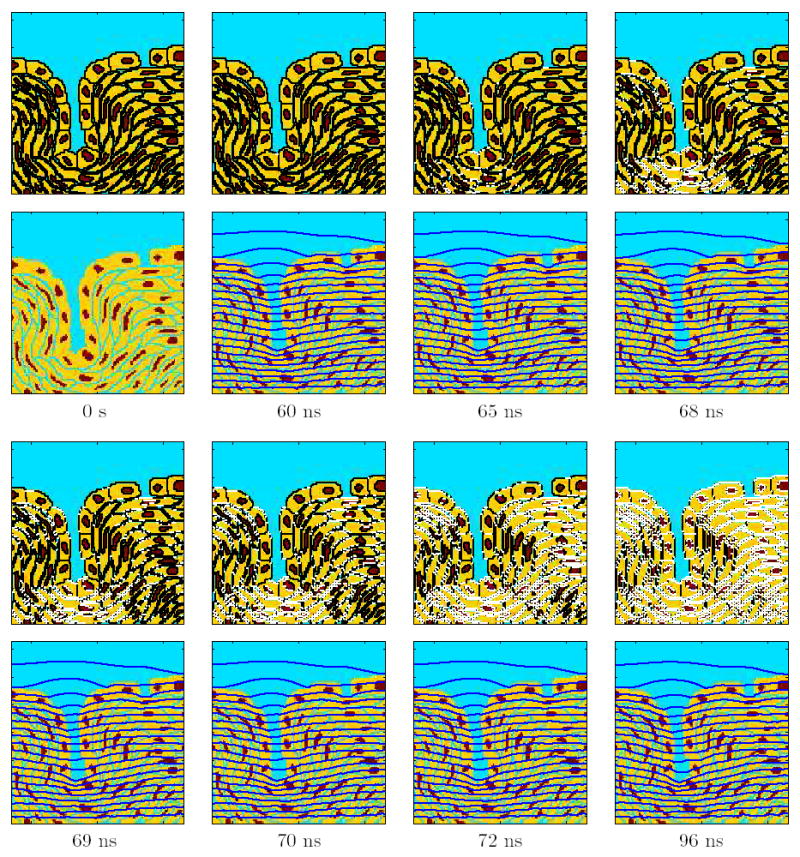
Temporal evolution of the response of the multicellular system model to the pulse. The top panels show the sites of EP (Np >10) in white, the bottom panels show the equipotential lines in dark blue, and the times are indicated at the bottom of each pair of panels.